Today it’s a bit off topic, however, there can be found of course a direct connection with Locus. But let’s not hurry. As map enthusiasts we would like to recommend a website that is sort of a shop window of a scientific institution named Oxford Internet Institute – Information Geographies. Admittedly it sounds quite abstract but looking closer we’ll find out that the team of Mark Graham presents here very interesting outputs of their research activities. Generally, they regard many aspects of internet in association with their geographical layout and there are real loads of them. We’ve selected three that are relevant the most to Locus:
Uneven Geographies of OpenStreetMap project
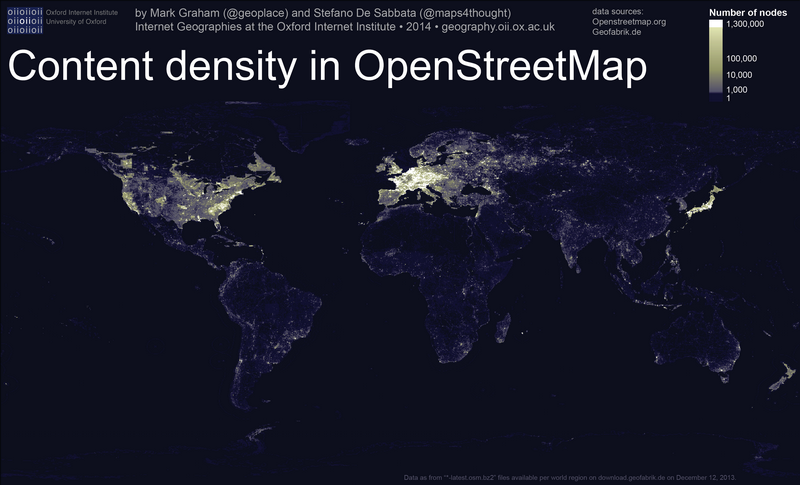
In three maps the institute clearly shows the state of coverage and updating of OpenStreetMap project maps, which is the source of data also for our LoMaps. Thousands of volunteers work on the OSM maps around the whole World and once, maybe, it’ll become the most accurate and detailed map work worldwide. However, as you can see on the first map, the basic OSM coverage maps thoroughly only the most populated and developed countries and its visualization resembles NASA pictures of the night Earth from the orbit. The United States account for the largest total amount of content, collecting 21% of all nodes (georefferenced items) present in OpenStreetmap (OSM), followed by France, Canada, Germany and Russia, all counting more than 100 million nodes. These five countries alone collect 58% of the content, and high-income OEDC countries sum up to about 80% of OSM.
The Netherlands enjoy the highest density of content, with an average of over 1000 nodes per square kilometre, followed by Belgium with over 700 nodes per square kilometre, and Germany, the Czech Republic, Switzerland, and France, with about 400 nodes per square kilometre. The rest of the World is covered vaguely and the Southern hemisphere is barely visible with Africa and Latin America represented by less than 5% of the content. California alone accounts for almost as much content as the entirety of Africa. Interestingly, content in parts of North Korea lights up the map: an unusual situation for a country not renowned for even appearing in most indices of online participation. This is most likely thanks to work done in 2011 by the OSM developers community.
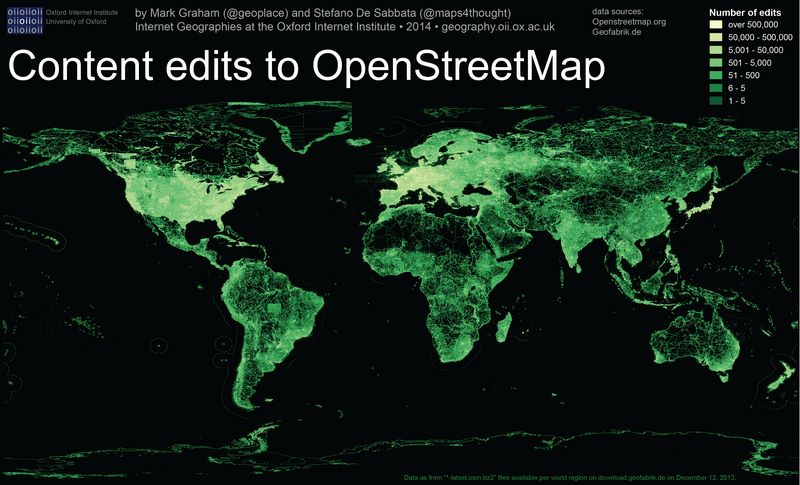
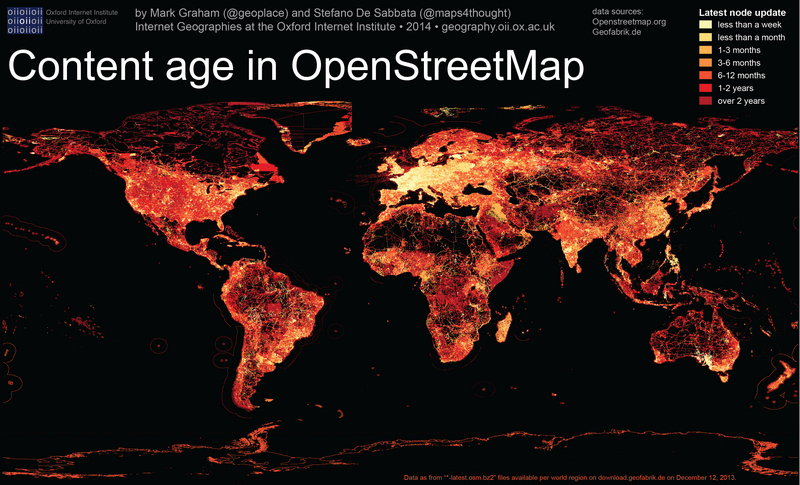
Similar results bring the second map of content edits and age. Unsurprisingly, the most content-dense areas are also the most heavily edited, because each new node included means one more edit made within the related area. It is not surprising that most areas in Europe have seen at least one edit in the week before the data were collected. Similarly, it is evident how the most remote regions of the world have not been updated for years, from Siberia to the Australian Outback, from central Africa to the Amazon basin and northern Canada.
Not everything is in Wikipedia
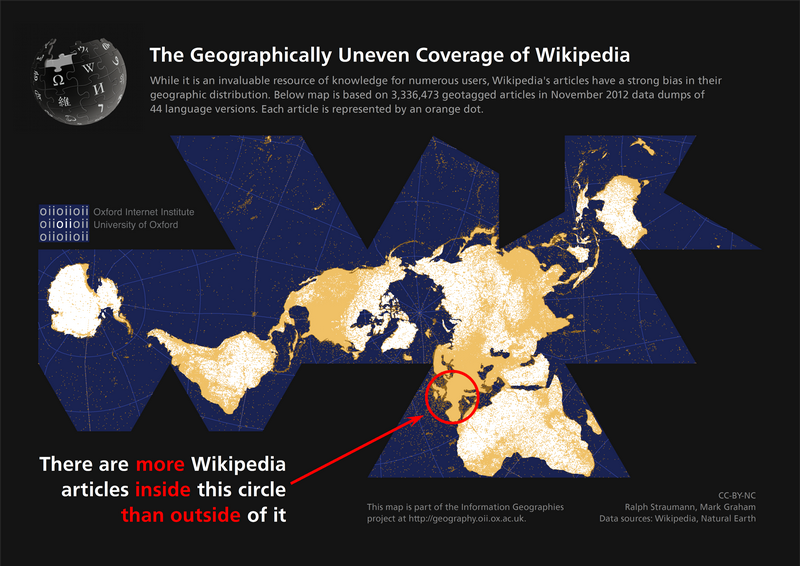
Wikipedia is another community driven mega project similarly as OSM and a great part of its registers (cca 3.5 milion items) are geographically defined places – Locus can search in them, of course, and display the results above your favorite map. Seemingly, Wikipedia provides answers for all your questions but as the research of the Oxford Institutu proves, it’s not so big deal in the area of geography or our planet. Over a half of all its georefferenced items can be found within an area covering only some 2,5% of the world’s land area! See inside the red circle on the map:
GeoNames Gazetteer
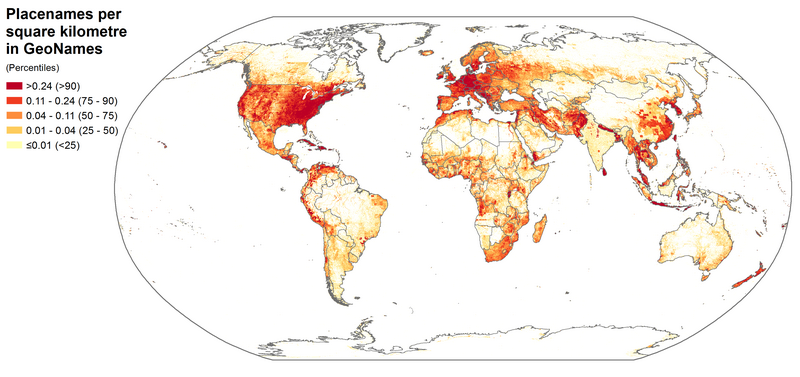
Another source of place search that Locus offers is GeoNames, the largest freely available gazetteer (i.e., a dictionary of geographic place names) covering the globe. It is based on freely available national gazetteers and datasets, as well as volunteered geographic information (VGI). This means that, in theory, anybody can enter data, suggest new place names, and edit existing content. Unlike the previous two databases, GeoNames visualizations do not really resemble a map of population. Instead, we see dense clusters of place names in some parts of the world and a lack of geographic information in others. Interestingly, the information presences that we see are characterized by unusual patterns. Not only do we see the usual suspects of Western Europe and the United States with large amounts of geographic information, but we also see significant densities in places like Sri Lanka, Iran, and Nepal. Iran counts almost the same number of placenames as Germany. North Korea is described in almost as much detail as Austria, and Sri Lanka counts even more placenames. Researchers provide a few reasons of this disparity, one of them is that some of these patterns exist due to the fact that the National Geospatial-Intelligence Agency’s (NGA) and the United States Board on Geographic Names are the sources of many place names outside the United States and Canada. Created in 2003 as part of the U.S. intelligence, the strategy of the NGA is to provide “support to military and intelligence operations, intelligence analysis, homeland defense, and humanitarian and disaster relief”.
Anyway, it’s worthwhile to go through the Oxford Internet Institute projects more thoroughly. Take this article just as a bait for some interesting evening reading.
geonamesinformation geographiesopenstreetmapsoxford internet institutewikipedia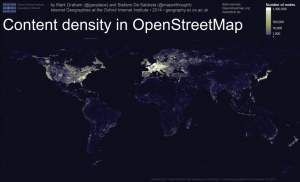


0 Comments