
Der Sommer heizt uns allen ordentlich ein, und da wir keine großen Freunde des Faulenzens am Wasser sind, entkommen wir der Hitze entweder im Wald oder auf dem Fahrrad. Und das ist die perfekte Gelegenheit, unsere neuesten Updates auszuprobieren. Wir haben die Routendiagramme erneut verbessert — Sie können nun direkt im Detailbereich der Route aktiv mit ihnen arbeiten. Außerdem öffnen wir Locus Map für eine breite Palette von E-Bikes und Community-Sensoren. Werfen Sie also einen Blick auf alle Neuerungen und darauf, warum sich das Update noch heute lohnt.
Diagramme zum Anfassen
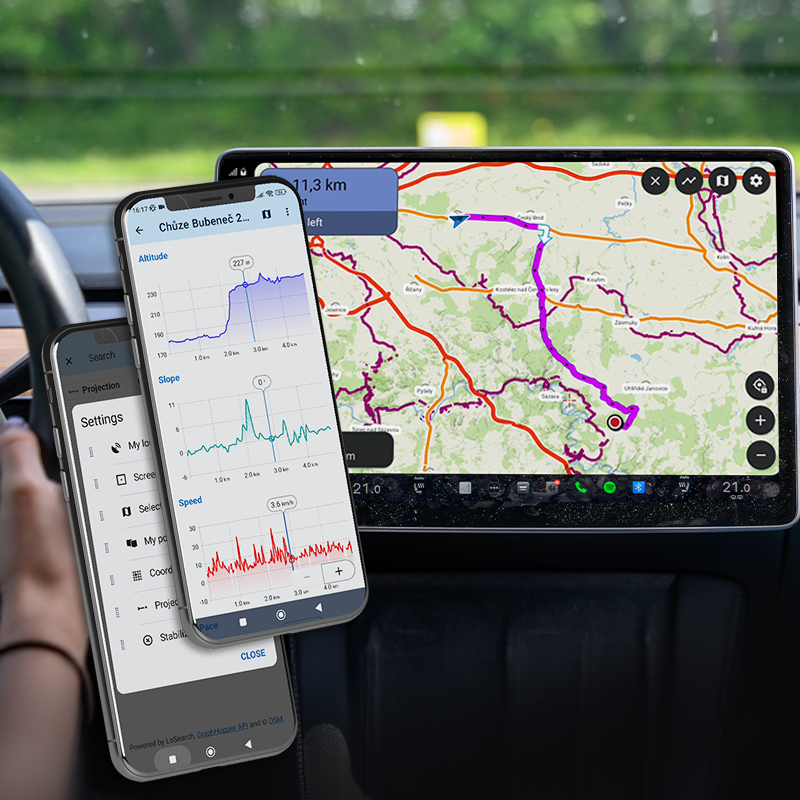
Bisher konnten Sie das Höhenprofil im Detailbereich der Route nur betrachten. Jetzt können Sie damit interagieren, ohne das Vollbild-Diagramm öffnen zu müssen. Zoomen Sie mit einer Pinch-Geste hinein, scrollen Sie und beobachten Sie, wie der entsprechende Abschnitt direkt auf der Karte hervorgehoben wird. So wissen Sie immer, welchen Teil der Route Sie gerade betrachten. Der blaue Punkt im Höhenprofil markiert zudem Ihre aktuelle Position auf der Route — nützlich etwa, um abzuschätzen, wie weit Sie vom nächsten Anstieg entfernt sind. Das Zoomen ist flüssiger, selbst bei sehr langen Aufzeichnungen und über Pausen hinweg, in denen Sie angehalten haben. Sie können bis auf eine Ebene von 100 m oder 1 Minute heranzoomen, unabhängig davon, wie lang die Route ist.
Brauchen Sie mehr Platz für die Karte? Heften Sie das Diagramm an, und alle übrigen Routendetails werden ausgeblendet. Lösen Sie es wieder, um zur vollständigen Ansicht zurückzukehren.

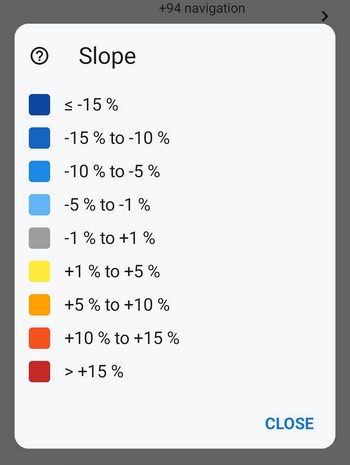
Auch die Farben zur Darstellung der Steigung haben wir neu gestaltet. Die Skala reicht nun von Blau für Abschnitte bergab (wobei dunklere Töne ein steileres Gefälle anzeigen) über Grau für flache Abschnitte bis hin zu einer Gelb-Orange-Rot-Skala für Anstiege — sowohl in der Füllfarbe des Diagramms als auch entlang der Routenlinie auf der Karte. Eine neue Legende (tippen Sie auf das Fragezeichen im Editor für den Linienstil) erklärt genau, was jede Farbe für die aktuell angezeigte Variable bedeutet.
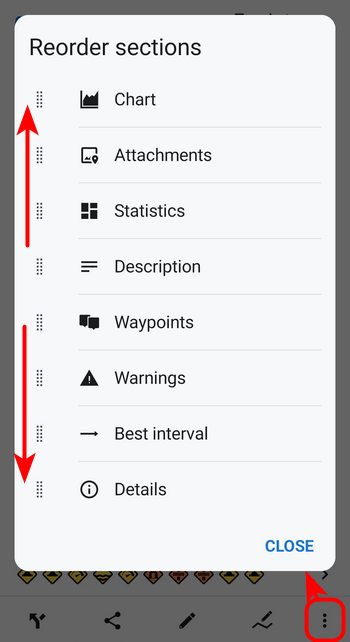
Im Menü „Werkzeuge“ im Detailbereich der Route haben wir außerdem eine Option ergänzt, mit der Sie den Bereich nach Ihren Wünschen anpassen können — Sie bestimmen jetzt die Reihenfolge der einzelnen Abschnitte (Diagramm, Statistik, Wegpunkte und mehr).
Die Daten Ihres E-Bikes auf dem Dashboard
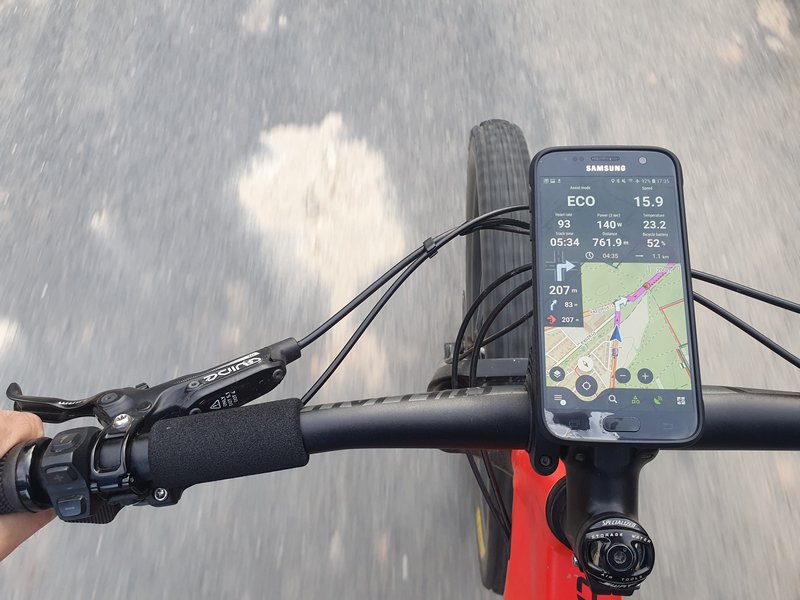
Wir haben die Unterstützung für die Verbindung externer Sensoren über Bluetooth erheblich erweitert — dieses Mal um eine ganze Reihe von E-Bikes: Bosch eBike Smart System (v19+), Shimano STEPS (EP-8, EP-801, E5000/E7000/E8000, EW-EN100), Fazua Ride 50/60. Außerdem haben wir die Unterstützung für Specialized-Bikes über die Generationen TCX 2/3/4 hinweg ausgebaut. Neben den grundlegenden Daten zu Akkustand, Geschwindigkeit und Trittfrequenz erhalten Sie überall dort, wo Ihr Bike sie bereitstellt, auch umfassende Telemetriedaten — Motorleistung und -temperatur, Akkustand und Anzahl der Ladezyklen, verbleibende Reichweite, Steigung und den aktuell eingelegten Gang. Gang und verbleibende Reichweite können Sie außerdem Ihrem Dashboard hinzufügen.
Die Verbindung ist derzeit allerdings nur einseitig: Sie können die Daten des E-Bikes in Locus anzeigen, jedoch nicht umgekehrt. Das bedeutet, dass sich die Navigation aus Locus noch nicht auf dem Display des E-Bikes spiegeln lässt. Eine tiefere Integration zwischen der App und der Firmware des E-Bikes würde eine engere Zusammenarbeit seitens der Hersteller erfordern.
Wichtig ist auch der Hinweis, dass diese Unterstützung inoffiziell und bislang nicht verifiziert ist — wir konnten nicht alle Kombinationen aus Modellen und Firmware testen. Umso mehr freuen wir uns über jedes Feedback: Sie helfen uns damit, diese Unterstützung weiter zu verbessern und für möglichst viele Bikes zu optimieren.
Darüber hinaus ist Locus Map nun auch für von der Community entwickelte Sensor-Adapter offen. Apps von Drittanbietern können ihre eigenen Sensoren einbinden — spezielle BLE-Geräte, Protokolle bestimmter E-Bikes und eigene Hardware — und die Echtzeitdaten dieser Sensoren erscheinen im Sensor-Manager, auf dem Dashboard, im Audio-Coach und in der Routenaufzeichnung. Das Entwickler-SDK finden Sie unter github.com/asamm/locus-api.
Und das ist noch nicht alles!
Wie üblich bietet die neue Version natürlich noch viel mehr. Zu den wichtigsten Neuerungen gehören:
- IMG-Karten für Garmin: Wir haben den Karten-Renderer für das Garmin-IMG-Format komplett neu geschrieben. Wenn Sie diese Karten verwenden, dürfen Sie sich auf eine sauberere und konsistentere Darstellung freuen — und auf eine solide Grundlage, auf der wir weiter aufbauen werden.
- Akku schonen: Führung und Navigation können nun automatisch pausieren, sobald Sie sich nicht mehr bewegen, damit eine vergessene Sitzung den Akku Ihres Telefons nicht leert.
- Kalorienverbrauch: Die Schätzungen sind genauer — das Gelände (bergauf und bergab) wird jetzt berücksichtigt, und die Werte basieren auf dem Compendium of Physical Activities 2024.
- Geocaching: Sie können ältere Logs wiederherstellen und durchblättern; die Logs von Freunden werden unter dem Reiter „Freunde“ gruppiert; und die Live Map funktioniert nun auch mit Android Auto.
Sobald also die schlimmste Hitze vorüber ist, ziehen Sie mit der neuen Version von Locus hinaus in die Natur — und lassen Sie uns wissen, wie sie Ihnen gefällt!
androiddashboarde-bikeHöhendiagrammsensors
59 Comments
Ešte by sa pýtalo myslieť aj na užívateľov iných značiek hodiniek, ako Amazfit. Ale idete správnym smerom 👍
Dobrý den, hodinky Amazfit bohužel pracují s natolik uzavřeným systémem, že se nám zatím nepodařilo objevit způsob, jak je propojit s Locusem.
jaké jiné značky hodinek spolupracují s locusem? taky mám amazfit....
Dobrý den, hodinky se systémem Wear OS a vybrané modely hodinek Garmin.
Graph pinning is a very useful feature, however on my Galaxy S23, when pinned, unnecessarily way types and surface are visible, covering all together 50% of the screen. I hope, this is just a bug and will be fixed soon.
Hi Ed, this is not a bug. We keep the surface/type graphs on because many users use them to evaluate the route ahead.
Hi, on the screenshot above with pinned chart, these are not visible.
From the perspective of an cyclist, the climbs information is much more valuable then road/surface types. Especially for bike touring/packing, showing the elevation chart with colour coded sloped is an excellent option, but not necessarily when half of the map is hidden. Maybe an 2 step pinning?
Another very valuable addition: a zoom in button, just left of the pin button, showing e.g. 1km around the current location/selected point on the route. Pinch to zoom is quite a usability problem, especially on rough terrain.
You can display the route graph on a dashboard without surfaces and road types. The route detail panel is better for viewing when you are not in the middle of an activity.
I can't find the surface type graph on my app. Do you need a gold subscription for that feature?
Yes, the types and surfaces are only available with Premium Gold.
Im Editor für den Linienstil kann ich kein Fragezeichen finden, das mir die Legende anzeigen würde. Kannst du etwas genauer beschreiben, wo man genau drücken muss?
It is not in the editor - it is next to the line style preview in the route detail panel.
I agree it is hard and not intuitive to find. Perhaps it would be useful to access the legend from the Chart settings as well? E.g. below 'Slope Colors - checkbox' add 'Legend - question mark button'?
@Marco: Das Fragezeichen erscheint in der Track-Details nur dann, wenn der Linientyp NICHT einfarbig ist. Das hatte mich anfangs auch verwirrt.
The slope colours are a very welcome upgrade, thank you!
Is it possible at this time to change the colours per slope bracket or the slope limits per bracket? I want to use this primarely for hiking, where I want other slope values.
Das interessiert mich auch.
Hi Kenny, no, this is not possible. The slope coloring always relates to the whole route.
Thank you for your reply Michal. Are there plans on the roadmap for this? The way Till described it would be perfect!
I also think this would be great! For hiking, slope gradients above 40% are common, and the difference to a >15% category is massive, but not visible in the slope colors.
Previously it was possible to adjust the line style for slope colors (it still is for altitude colors), but the button is greyed out in this new version now. So in the future, it would be great to customize the slope coloring to your needs:
- change colors for each category
- change percentage brackets for each category
- add/remove categories.
The user interface could be similar to the slope legend (see photo above), where you change the color/percentages by clicking on them. And buttons to add/remove categories. To get to the customization interface, you could use the button that already exists in 'Line Style' and was used previously.
___
Also I agree that the slope legend should be accessible from the line style menu. It is hard to find (I am still searching :P)
Hello, if you have any ideas on how to improve the app, submit a suggestion at help.locusmap.eu and let other users vote on it. If the idea gains support, we'll start considering implementing it.
I can't connect to my bosch e-bike. (Gen 4, smart system) I tried everything for an hour, no luck. It shows on my bluetooth paired list, but Locus won't find it at all.
Hope it will get better and simpler in the future.
Thanks for new features.
I tried to connect my new ebike but had no success.
Drive unit Bosch Performance Line CX (BDU3840),
Kiox 300.
Hope it will work soon.
I´d be waiting to see my Bosch Smart System Bike data in locus maps for long time, also due to I have choosen a bike without display unit. Sadly, actually it does not connect. Even if bike is paired to phone, no connection found in Locus. Bike is equipped with no display, system controller BRC3100, SW Version 20.9.0 and drive unit BDU3144, SW Version 20.27.0. Boundary condition: BT-Connection to phone is used as anti theft (no phone connected, no drive assist). In above non-connectivity scenario, bike is unlocked and working being paired to the phone with correct credentials.
Would be extremely glad, if the system will work.
Now - 2 days later - connection of my eBike with above mentioned components works. Not sure, what made the difference, eventually by overnight update to locus 4.36.00. Great function, I implemented Cadency, Battery SOC and Assist mode on my locus dashboard, where the data was displayed reliably during todays 60 km bike trip.
Hi Thomas, the new version 4.36+, which was launched on Google Play recently, contains a refined method for connecting to Bosch motors. Please test it and let us know the result. Thanks.
Kann ich bei Locus Map 4 weiterhin die Offline-Freizeitkarten-OSM verwenden? Wäre für mich Voraussetzung für einen Umstieg.
natürlich.
Yes, we haven't changed anything regarding the use of these maps.
The ebike feature worked fine with my Orbea Rise Shimano EP8
I can get live on my dashboard battery level, cadence, bike speed, assist mode
I see I could also have the gear ratio if I also had a Di2 derailleur.
However only speed and cadence are save in the GPX export
Would be great to have the other data exported too
Thanks Locus Team
IMG mapy pro Garmin: kompletně jsme přepsali vykreslovač map ve formátu Garmin IMG . Pokud tyto mapy používáte, čeká vás čistší a konzistentnější vykreslování — a solidní základ, na kterém budeme dál stavět.
Co toto přesně znamená. Mohu v Locusu zobrazit mapy Garmin IMG?
Nebo mohu Lomapy převést do formátu Garmin IMG?
Děkuji
Dobrý den, v Locusu by se měly nyní korektněji zobrazovat mapy v IMG formátu. Převod map není k dispozici.
SLOPES: este by ste mohli pridat jednu / dve kategorie kde by bola moznost nastavit vlastne % a farbu idealne podla aktivity, pripadne aj s moznostou vystrahy, ktora by sa zobrazila vramci detailu potobne ako waitpointy,
kazdy by si potom mohol nadefinovat aku uroven stupania/klesania zvladne a mohol si preplanovat trasu, ak by tam bol prenho nebezpecny usek, nieco ako ma komoot ale ktomu este nastavitelne,
(zonam stupani a klesani by tiez nebol na zahodenie s %+km+v.m)
a este si neodpustim poznamku mimo temy, POI Library, je to take roztahane oproti 3.x, aj v kompakt zobrazeni, kopec volneho miesta medzi riadkami, ikonky zbytocne malicke, opat nevyuzity priestor okolo
Dobrý den, pokud máte nápady, jak vylepšit aplikaci, vytvořte ideu na help.locusmap.eu a nechte pro ni hlasovat ostatní uživatele. Pokud nápad získá podporu, začneme uvažovat o jeho implementaci.
Varování před překážkami na cestě je již implementováno do plánovače tras a navigace.
Knihovna je díky vzdušnějšímu designu nyní mnohem přehlednější.
Great update! The addition of interactive charts is fantastic, and the gradient coloring looks amazing.
With these coloring improvements already in place, it feels like the perfect foundation is finally here to introduce a Garmin-like ClimbPro view during navigation. The cycling community has been hoping for a dedicated climbs overview for a few years now, and this update makes it feel closer than ever! Is this something the team might be able to bring to life soon?
Thanks for the constant improvements, keep up the awesome work!
Hi Andrey, something like "ClimpPro" would be awesome in Locus Map. We're definitely not throwing this idea away. Thanks for your support!
When you tapped a point on your track in Locus Classic there appeared a pop-up that showed how munch km you travelled and how far you still had to go. It also showed the number of meters going up and down. That was a very nice feature. Is that coming back to this version? Maybe next to the graph?
Hi Bas,
this option is available and it is even better - Locus Map displays not only the distance from/to the start and end of the track but also elevation gain and estimated time of arrival. The only difference is that the information is two clicks away, not just 1 as it was in Locus Classic.
WHERE? I can't find it. I miss this very much!
Hi, tap the trackpoint button in the bottom left of the track detail panel. More info: https://docs.locusmap.app/doku.php/manual:user_guide:tracks:about#trackpoint_detail
Hi, overall a great update with the slope and pinned graph! Almost exactly what I was hoping for!
Some feedback and things I noticed:
1.) New gradient categories & colors are not sufficient for hiking
The slope colors are great for cycling, but not so much for hiking. A single >25% category is not sufficient as gradients can be easily above 40%. The difference between 25% and 40% is massive, but not visible in the new color scheme.
So perhaps give us extra colors for hiking activity tracks or the option to customize the gradient categories (see next point)?
___
2.) Add customization options to slope colors:
Previously, you could customize slope colors in Line Style (as you can still do with Altitude). In general, the new colors are great, but sometimes I'd like to adapt them to my needs (e.g. for hiking).
The button to edit slope colors in line style still exists, but is currently grayed out. So perhaps in the future, you could add customization options for colors and percentages. The interface could be similar to the slope color legend, where you can change:
1.) pick slope color
2.) adjust percentages for a gradient category
3.) add or remove gradient categories (with custom color and percentages as above)
For example, I would prefer white instead of grey for flat segments, as it is better visible when viewing the device in bright sunlight due to better contrast on my maps. Others may like gray better ofc. Also I would add another color for extremely steep gradients like light purple for >30%. Deep purple for >40%.
___
3.) Button to toggle graph between zoomed out and last remembered zoom:
When you zoom into the graph, a button gets displayed to zoom out again. The button disappears when fully zoomed out. Since pinch-to-zoom is a pain in the ass when riding a bike on a bumpy road, it would be great if the button is always shown, but toggling between zooming in and out.
Some possible toggling options:
- 2 stage toggling: zoom out zoom in to a detailed view (e.g. showing next 5km).
- 2 stage toggling with remembered zoom: zoom out zoom in to last remembered zoom level (set this with pinch to zoom). Would be my favorite as it is easily customized to your needs and very flexible.
- 3 stage toggling: zoom out -> zoom in to 5km -> zoom in to 1km (-> zoom out -> ...)
- Possible with an advanced mode to customize the zoom intervals to your needs (e.g. 1km, 5km, x km, or remember last zoom level). probably unnecessary complicated though.
____
4.) Picker bubble should show slope percentage if slope colors are enabled (without a separate slope graph selected)
If you show an Altitude graph with Slope colors enabled (but without a 2nd Slope graph on the other y axis), the picker bubble only shows distance and altitude. Since slope colors are enabled, the picker bubble should also show slope in %.
___
5.) Show Energy in both calories and kJ, or toggle between units by clicking on field
In the details of the track it would be cool to not only show the energy in kJ but also in calories (or toggle between units by clicking on it). Some people prefer kJ, others calories. I personally can judge calories better, whereas kJ is less intuitive for me.
___
6.) Bug: clicking elevation graph for a single segment in route planner moves cursor to wrong position on the map
In route planner, when selecting a segment between waypoints, the elevation graph plops up. When clicking on the graph, the map cursor moves, but the cursor moves to the middle of nowhere, and does not stay on the track.
If you show the graph for the whole track, not just a single segment, clicking on the graph moves the map cursor to the position on the track as intended.
_____
Thank you for continously improving this already greatest map app!
Hi, thanks for your ideas but the comment section under the article is not the right place. If you have any ideas on how to improve the app, please submit a suggestion at help.locusmap.eu and let other users vote on it. If the idea gains support, we'll start considering implementing it.
If you navigate a route that was created before the current version, the waypoints are not announced and the distance is not displayed on the dashboard (the distance to the destination is always displayed).
If you add a waypoint or replan the route, it works as it did before.
=================================================================
Navigiert man eine Route, die vor der aktuelen Version erstellt wurde, werden die Wegpunkte nicht angesagt und im Dashborad die entfernung nicht angezeigt (es wird immer die Entfernung zum Ziel angezeigt).
Fügt man einen Wegpunkt dazu oder plant neu, dann funktioniert es wie früher.
Hi, we are sorry for any inconvenience. If you encounter any issues with the app, please contact us at https://help.locusmap.eu and provide a detailed description of the problem. We'll be happy to help.
v této verzi již není možné upravovat parametry (data), které se zobrazují na panelu při spuštěném záznamu trasy? resp je možné upravit (odstranit) "funkce", ale nikoli "tlačítka,grafy"
Dobrý den, tlačítka a grafy nebyly na panelu záznamu trasy nikdy editovatelné. V této části aplikace jsme nic neměnili.
Dobrý den, děkuji za odpověď. Nemyslel jsem editaci samotného grafu, ale jeho odstranění (nahrazení jiným parametrem) z panelu. V předchozí verzi to bylo umožněno (resp mě to fungovalo) po dlouhém kliknutí na parametr. V této verzi tento postup funguje již pouze u parametrů "funkce", nikoli "tlačítka, grafy".
Jestli si to náhodou nepletete s dashboardem - tam opravdu lze zapínat/vypínat grafy a tlačítka. Na panelu záznamu trasy lze měnit pouze políčka statistik, nikoliv graf a ovládací tlačítka záznamu. Nicméně ani na jednom z těchto míst jsme nic neměnili. Pokud chcete, napište nám na helpdesk help.locusmap.eu a pošlete screenshoty, ať víme, o co jde. Díky.
I added the idea for the interested:
https://help.locusmap.eu/topic/40861-configurable-slope-values-and-colours
Elevation profile is sooo tiny. I want ONE diagram, full screen, as before. Also I miss the actually recorded timestamps on x axis.
LOCUs je stále lepší a lepší a míří k absolutní dokomalosti... Mám jej o samých počátků a dnes samozřejmě GOLD verzi. Poslední aktualizace, integrace senzorů z E-bike Shimano do dashboardu je fakt super... Snad jen přání. Bylo by možno pořadí grafů libovolně přesouvat v pořadí? A k dashbordu snad už jen jedno přání z říše snů... Je ralizovatelné zabarvení pololožek (čísel) v dashboardu barevně např. podle rychlosti atd., podobně jako se barví průběžně trasa např. podle nadmořské výšky, rychlosti atp.?
Dobrý den, děkujeme za pochvalu! Aplikaci se snažíme stále vylepšovat podle přání našich uživatelů. Pokud váš nápad umístíte na náš helpdesk a necháte pro něj hlasovat ostatní uživatele, je možné, že bude v budoucnu realizován (pokud získá patřičnou podporu).
Ich habe ein EBike mit einem Bosch-Motor und einem SmartHub als Schnittstelle zum Smartphone. Leider scheint das ein älteres Hardware-System zu sein, das von der neuen Schnittstelle in LocusMaps nicht unterstützt wird (Locus->BES3; mein eBike->BES2).
Ist geplant auch das ältere Protokoll zu unterstützen, zumal das System und die Bikes mit 4 Jahren noch nicht wirklich alt sind ?
Kann ich bei der Entwicklung ggf. unterstützen ?
Hi, thanks for the detailed question, and for the offer to help. Unfortunately, BES2 is not something we can support. On the smart system, Bosch provides a Live Data Interface intended for third-party apps, which is what our integration uses. BES2 has no equivalent — reading it would mean reverse-engineering a closed, authenticated protocol without any vendor interface, which is well beyond what we can take on. We don't plan to add it.
Bude možnosť si plánovať trasy v plánovači trás (na Pc) na vlastných mapách...mám vlastné podrobné mapy s lesnými cestami Slovenska...hodilo by sa mi to...vo vašom plánovači veľa ciest chýba na SK a aj v PL...
Dobrý den, na vývoji řešení se pracuje, ale zatím jsme nevyřešili některé základní problémy, které mirroring map z telefonu na web blokují.
Purtroppo il collegamento con ebike bosch non funziona. Locus non riesce a vederlo. Ho provato ancheva dissociare l app flow. Dispositivi: Purion 200, locus 4.35.0 Gold, bosch 2.20.2. Aspettiamo sviluppi
Hi, please install the latest beta version from our public repo at https://bit.ly/lmVersionsTest. The issue with the Bosch e-bikes should be fixed.
Hi,
ein Dashboard das bereits konfiguriert ist,wie im Bild zu sehen ist, wäre schön wenn es in der Auswahl erhalten ist.
Oder ich mir das herunterladen kann.
Tolle Entwicklung und für mich die beste App. Klar habe ich wünsche und Vorschläge...
Grüße
Hi, thanks for your kind words of support! The dashboard used on the photo is derived from the "Basic LM4 top-bar" dashboard. Such dashboard edit is easy to do, see https://docs.locusmap.app/doku.php/manual:user_guide:tools:dashboards.